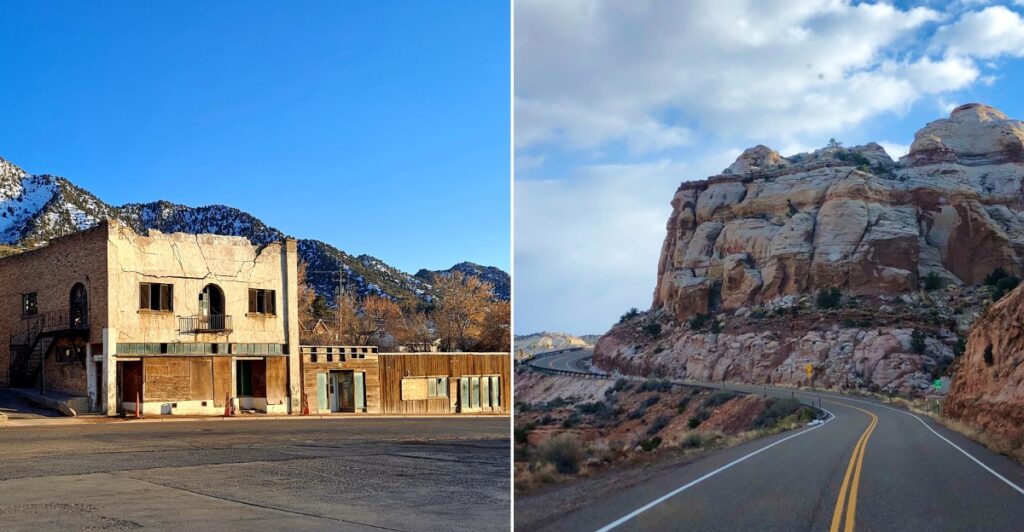
A state can look young on paper while some of its smallest communities are quietly moving in the opposite direction. Recent estimates point to slight population declines in several towns across Utah, where median ages also sit above the statewide average.
That combination matters, but it needs careful reading. The figures describe an older population profile, not proof that every community is aging year after year.
What makes the numbers interesting is everything behind them: younger residents leaving for school or work, longtime locals staying rooted, and small towns figuring out how to remain viable as demographics shift. In parts of rural Utah, population statistics are not just abstract percentages.
They connect directly to schools, businesses, housing, services, and the future of community life. The real story is not simply that these towns are older.
It is how they balance history and continuity with the difficult question of who will choose to stay next.
1. Escalante, Garfield County
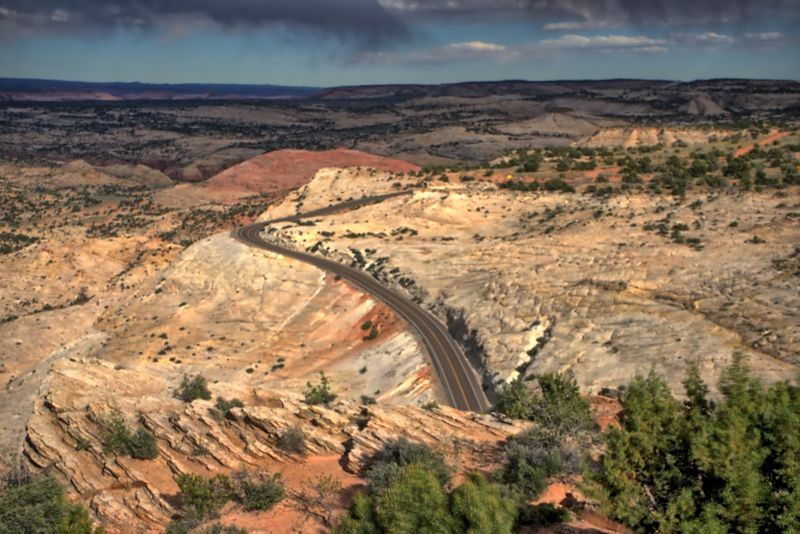
A median age of 59.1 gives this small community a very different profile from the state around it. Escalante stands out most clearly among the supplied towns, with an age midpoint nearly twice Utah’s roughly 32 years.
The 2025 population estimate is 745, down 10 residents from 2024. That equals a decline of about 1.3%, a modest number on paper that carries more weight in a community this small.
Located in Garfield County, Escalante is associated with the sandstone country of Grand Staircase-Escalante National Monument. Its outdoor identity helps explain why travelers recognize the name, but visitor interest and permanent population growth are not the same thing.
For anyone considering a move, the useful questions are practical: Where are essential services, what housing is available, and how far would regular appointments require traveling? A vacation can reveal the landscape without revealing the full rhythm of living there.
The age figure describes a midpoint, not the age of every neighbor. Still, paired with the population loss, it makes Escalante a strong example of an older community becoming slightly smaller.
The sensible takeaway is to look beyond scenery and ask how daily needs are being met for residents across different stages of life today.
2. Hatch, Garfield County
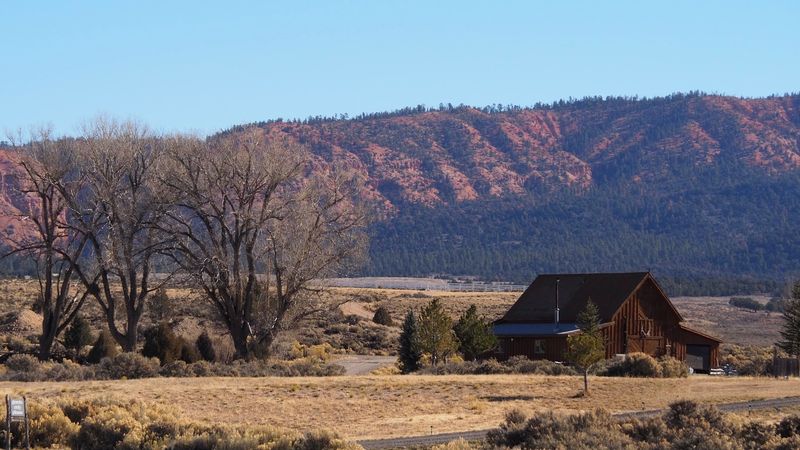
Two residents would barely register in a large city. In Hatch, that same change represents roughly 1.5% of the population, which is why small town numbers deserve a second look before anyone waves them away.
The supplied 2025 estimate places the population at 131, down from 133 the year before. Its estimated median age is 45.9, and roughly one third of residents fall within age groups starting at 60.
Hatch sits along U.S. Route 89 in Garfield County, in the Sevier River valley.
That highway connection gives the town a clear place on a road trip map, even when its resident count remains very small.
Age estimates here come with considerable uncertainty because the population is tiny. A few households can change the picture noticeably, so readers should treat the numbers as a useful sketch rather than a finely detailed portrait.
Before considering a longer stay or relocation, check the distance to groceries, medical care, and any services your household uses regularly. Highway access is helpful, but it does not answer every everyday question.
Hatch illustrates how a small numerical loss and an older age profile can matter together, without proving that either trend will continue at the same pace next year.
3. Helper, Carbon County
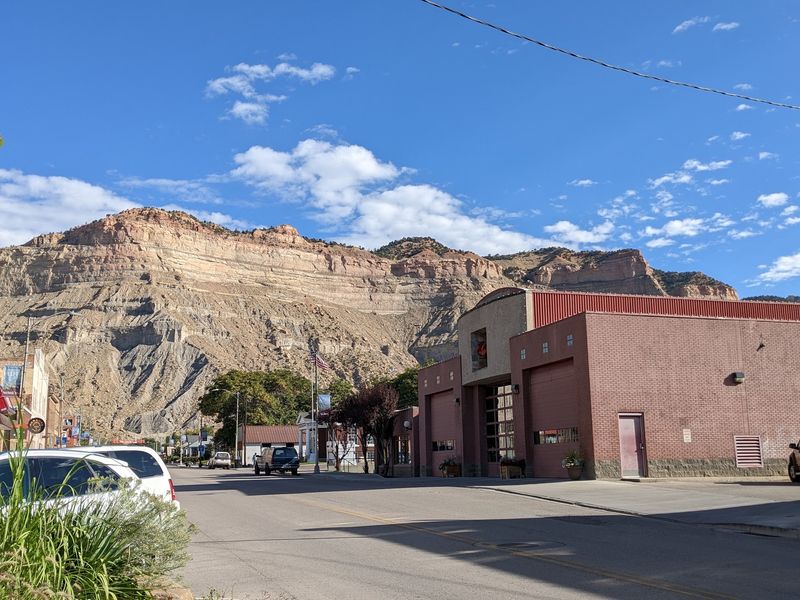
A restored Main Street can tell one story while a population table tells another. Helper is a good reminder that cultural renewal does not automatically bring more permanent residents, even when a town has built a recognizable arts identity.
The former coal and railroad community has turned toward arts and tourism while retaining its historic streetscape. Its name comes from the helper locomotives used to assist trains on the climb toward Soldier Summit.
For 2025, the supplied population estimate is 2,059, a decrease of three residents, or about 0.1%. The estimated median age is 44.4, roughly 12 years above Utah’s overall figure and above Carbon County’s median.
Those numbers describe near stability more than a dramatic retreat. They also show why an appealing downtown should not be treated as proof that a community has solved its housing, employment, or age balance challenges.
A visitor can appreciate the historic buildings without turning the trip into a demographic inspection. Anyone weighing a move should separately examine job options, housing availability, and access to routine care.
Helper’s story is neither simple decline nor instant revival: its public identity has changed, while the latest population estimate barely moved. Both facts belong in the same conversation about its future.
4. Green River, Emery County
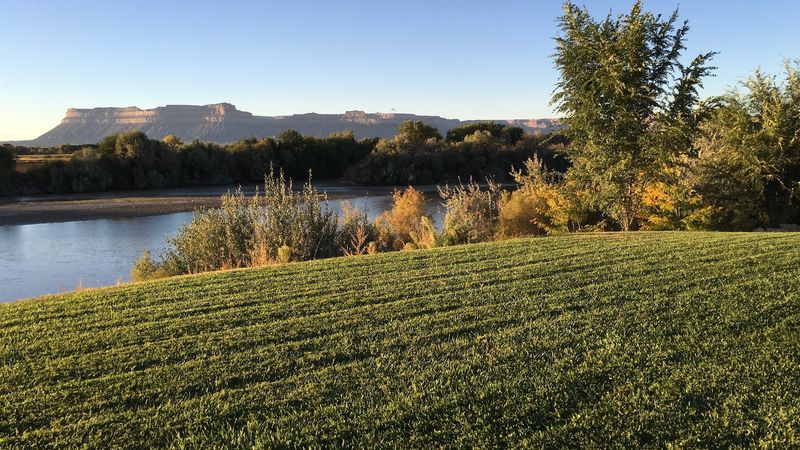
Passing through a town and putting down roots there are very different commitments. Green River makes that distinction easy to understand, thanks to its position along Interstate 70 and its familiar role in southeastern road travel.
The community is known for melons and shares its name with the river beside it. Those connections give Green River a distinct identity beyond being a place where drivers consult the fuel gauge.
Its supplied 2025 population estimate is 846, down two residents from the previous year, or about 0.2%. The estimated median age is 42.5, placing it roughly a decade above Utah’s statewide midpoint.
Neither figure suggests a sudden collapse, and a single year cannot establish a lasting direction. Together, however, they show a small community with an older population profile and a resident count that has edged downward.
For travelers, the useful distinction is between services aimed at people passing through and services needed throughout the year. For prospective residents, check employment options, housing, and the travel required for medical appointments rather than relying on highway visibility.
A town can be well known to motorists and still face difficult questions about keeping a balanced mix of ages. Green River’s numbers make that contrast especially easy to grasp.
5. Boulder, Garfield County
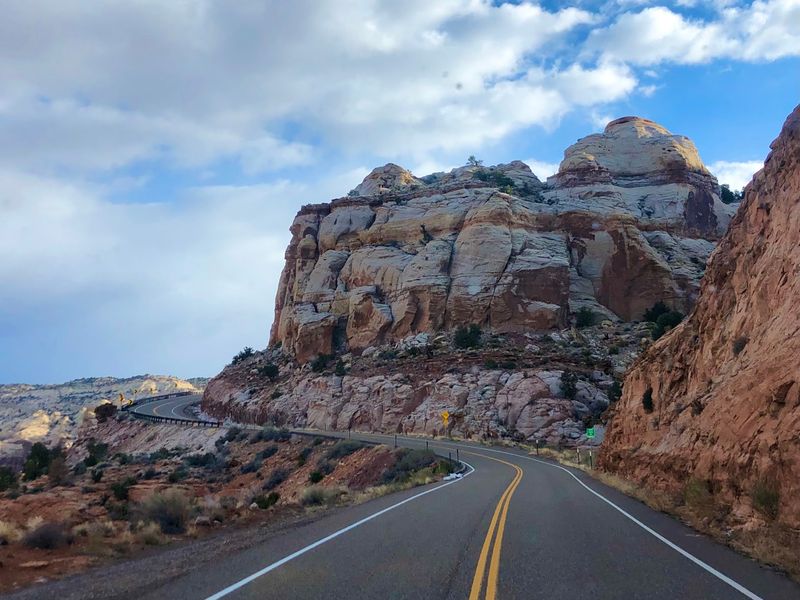
Small populations can produce age statistics that look surprising at first glance. Boulder has an estimated median age of 42.4, while the supplied age breakdown places approximately 44% of residents at 65 or older.
Those figures are not automatically contradictory, but they need careful reading. A median marks the middle of the age distribution, while a percentage describes one group, and survey estimates can carry substantial uncertainty in tiny communities.
The 2025 population estimate is 233, down one person, or about 0.4%, from 2024. That is a slight change, not evidence that the town is emptying at a rapid pace.
Boulder lies along Scenic Byway 12 in Garfield County and is home to Anasazi State Park Museum. Its archaeological setting distinguishes it from the other communities here, offering historical context that reaches far beyond modern population tables.
Before planning around the museum, check current state park information for hours and access. Anyone considering living in Boulder should also investigate housing and everyday travel needs separately from the appeal of the surrounding landscape.
The central demographic point is the sizable estimated older population, not the loss of a single resident. In a town this small, careful wording is more useful than a dramatic headline alone suggests.
6. East Carbon, Carbon County
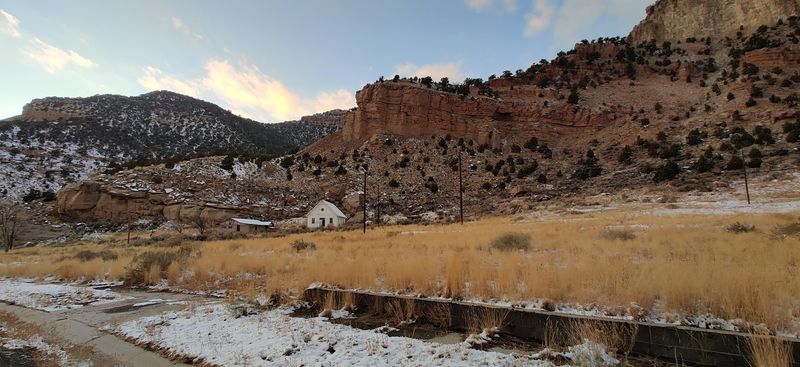
Mining shaped more than jobs in eastern Utah; it helped shape entire communities. East Carbon belongs to that history, which gives its population figures a different setting from the tourism towns elsewhere on this list.
The supplied 2025 estimate counts 1,510 residents, three fewer than in 2024. That decline works out to about 0.2%, small enough that it should be described as a slight decrease rather than a sweeping change.
Its estimated median age is 42.3, roughly 10 years above the statewide figure. The supplied age breakdown also places about 27% of residents between 60 and 79, with another share aged 80 or older.
An older population can raise practical questions about transportation, accessible housing, and reaching health services. The figures do not tell us which needs are unmet, so those questions require local information rather than assumptions about a former mining town.
For a prospective resident, start with the basics: available work, reliable transportation, and the location of routine appointments. A visitor should avoid reading every older building as a symbol of decline, since architecture cannot explain a population estimate.
East Carbon’s story rests on its mining background and present age profile, with a modest annual loss adding another piece to that picture.
7. Cannonville, Garfield County
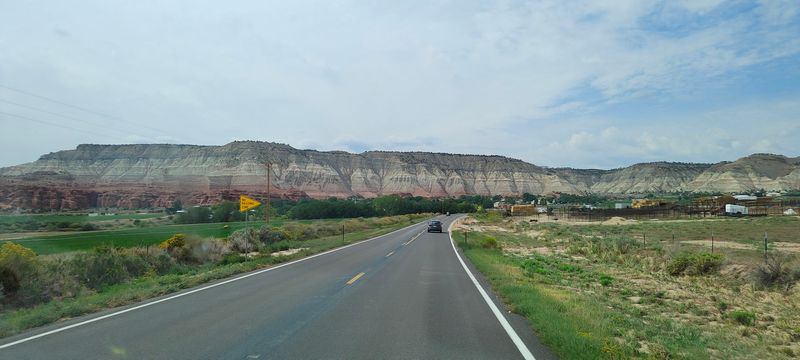
Percentages do the heavy lifting in a place with fewer than 200 residents. Cannonville lost an estimated three people between 2024 and 2025, but that small headcount translates into a decline of roughly 1.6%.
The supplied 2025 population estimate is 181, and the median age estimate is 41.6. Its age profile also includes a meaningful share of residents aged 70 and older, although small population surveys deserve cautious interpretation.
Cannonville sits in Garfield County along the Scenic Byway 12 corridor, near the turn toward Kodachrome Basin State Park. That location gives travelers a concrete reason to recognize the town without confusing nearby recreation with year round population strength.
If a park visit is part of your plans, consult current official information before adding activities or assuming access. The town and the state park are separate places, and their visitor needs should not be folded into one vague recommendation.
For someone considering relocation, the more useful checklist concerns housing, work, and distances to essential services. Three fewer residents cannot explain why people left, nor does an older median establish that the population aged during that same year.
Cannonville instead demonstrates a simpler point: in a very small community, seemingly minor changes can create noticeable percentage shifts.
8. Henefer, Summit County
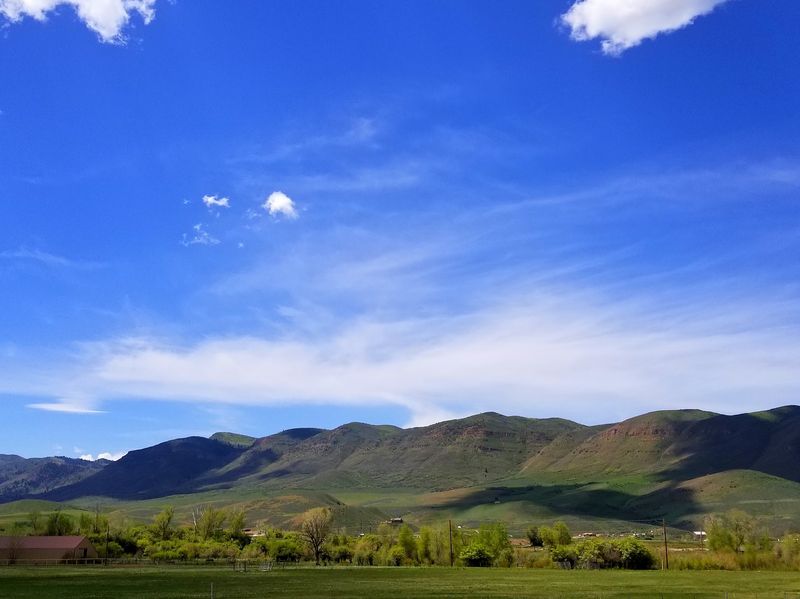
County boundaries do not guarantee that every community follows the same path. Henefer provides a northern counterpoint to the southern and eastern towns here, showing why a regional growth story needs a closer local look.
Located in Summit County in the Weber River valley, Henefer has a rural setting distinct from the county’s better known resort identity. It should not be treated as another version of Park City simply because both share a county.
The supplied estimate puts its 2025 population at 801, down eight residents from 2024. That represents a decline of about 1%, while the estimated median age of 39 sits above Utah’s roughly 32 year midpoint.
Compared with Escalante, the age gap is smaller, but it remains relevant within a generally young state. The figures describe an older local profile and a modest annual loss, not proof of a permanent demographic direction.
Households considering Henefer should compare actual commute routes, housing options, and access to services rather than borrowing expectations from nearby communities. For travelers, the valley setting offers geographic context, but a passing view cannot reveal who is moving in or out.
The lesson here is local scale: prosperity and population growth elsewhere in a county do not settle every town’s story.
9. Eureka, Juab County
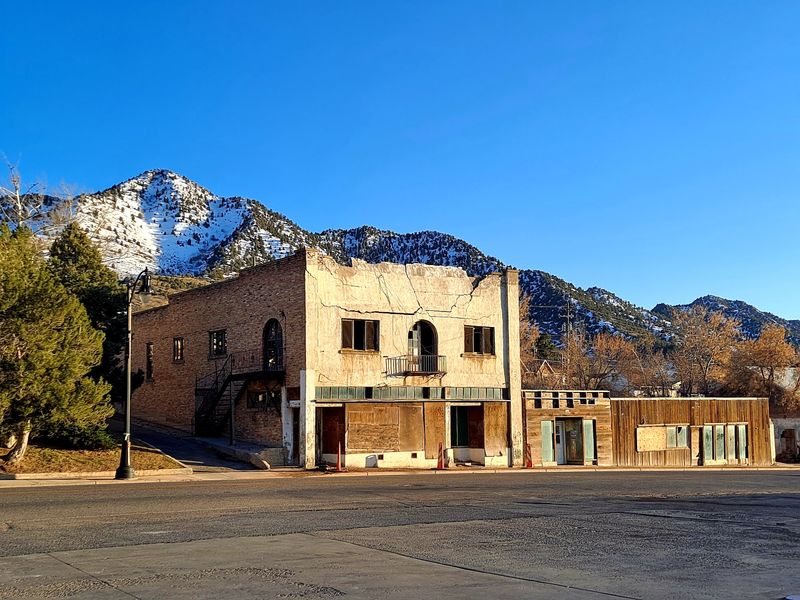
Old buildings are good at telling stories, but poor at reporting population trends. Eureka’s mining era streets provide historical context; the actual evidence for this article comes from its resident count and estimated median age.
The Juab County community developed within the Tintic mining district, an important part of the state’s mining history. That background gives Eureka a specific identity, rather than the interchangeable label of an old western town.
Its supplied 2025 population estimate is 655, one resident fewer than in 2024, a decline of about 0.2%. The estimated median age is 37.5, older than the statewide norm but well below the highest figures on this list.
A change of one person calls for restraint, not a prediction of disappearing neighborhoods. Likewise, a higher median does not establish that younger households have all left or that the town grew older within the last year.
Visitors interested in the mining legacy should distinguish public streets from private buildings and check access before planning around a particular site. Prospective residents should focus on present housing, employment, and service needs rather than treating historic architecture as a housing market report.
Eureka belongs here because of its supplied numbers, with its mining past adding context rather than supplying the conclusion.
10. Castle Dale, Emery County
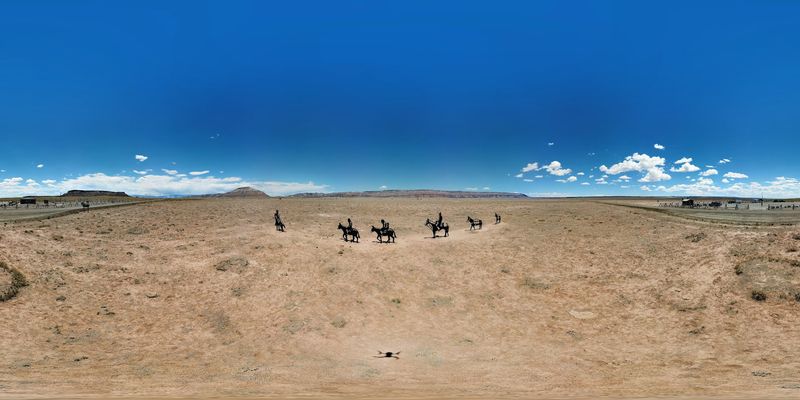
Not every entry needs a dramatic interpretation, and the final town deserves a measured one. Castle Dale has an estimated median age of 34.6, only modestly above Utah’s roughly 32 year statewide figure.
The supplied 2025 population estimate is 1,531, down two residents from the previous year. Its decline of about 0.1% is slight, making it the mildest example here rather than evidence of a major population slide.
Castle Dale is the county seat of Emery County and lies in Castle Valley. That civic role distinguishes it from several smaller communities on this list and helps explain why local population questions deserve their own attention.
Emery County’s estimated median age is about 38.9, higher than Castle Dale’s figure. The comparison is useful because it shows that even within an older region, individual towns can have noticeably different age profiles.
Before considering a move, investigate the services, housing, and work options that matter to your household instead of assuming the county seat label answers everything. A traveler can use the town as a geographic reference without turning a small annual change into a sweeping story.
Castle Dale closes the list with a useful reminder: demographic patterns have degrees, and the evidence supports a gentler conclusion here.